Playback insights
What your screens actually played — per day, per slide, per screen.
Where to find it
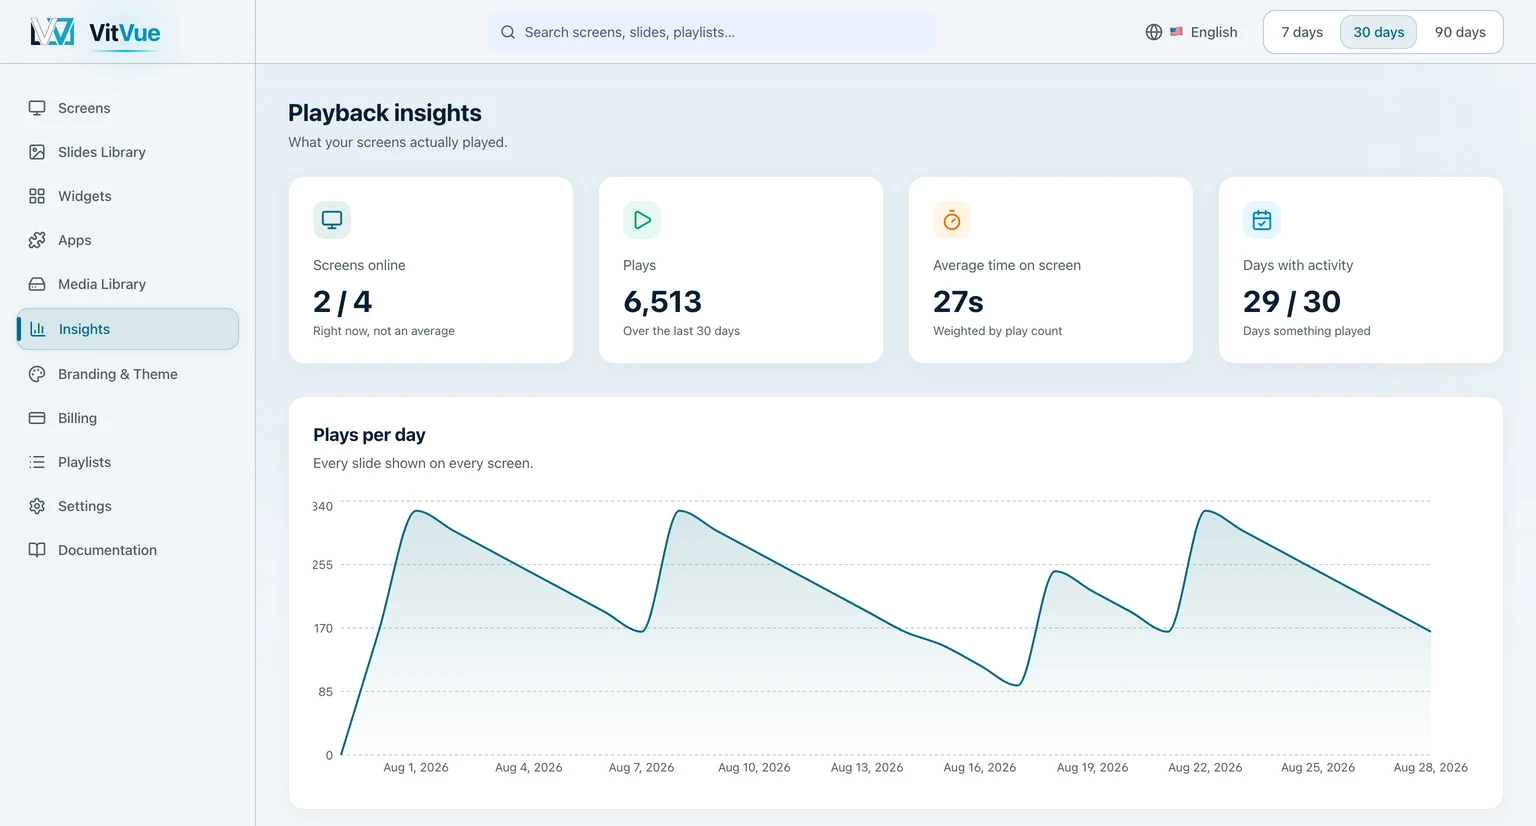
Insights in the sidebar. It is available to organisation admins; editors do not see it. Pick a range of 7, 30, or 90 days from the top right — everything on the page follows that choice. The figures load when you open the page and do not tick along on their own — reload to bring them up to date.
The four numbers at the top
- Screens online — how many are checked in right now, out of your total. Not an average over the range.
- Plays — every slide shown on every screen in the range.
- Average time on screen — how long a slide stayed up, weighted by play count so a slide shown once cannot outweigh one that ran all week.
- Days with activity — how many days in the range something played at all. A gap here usually means a screen was down.
What played, and where
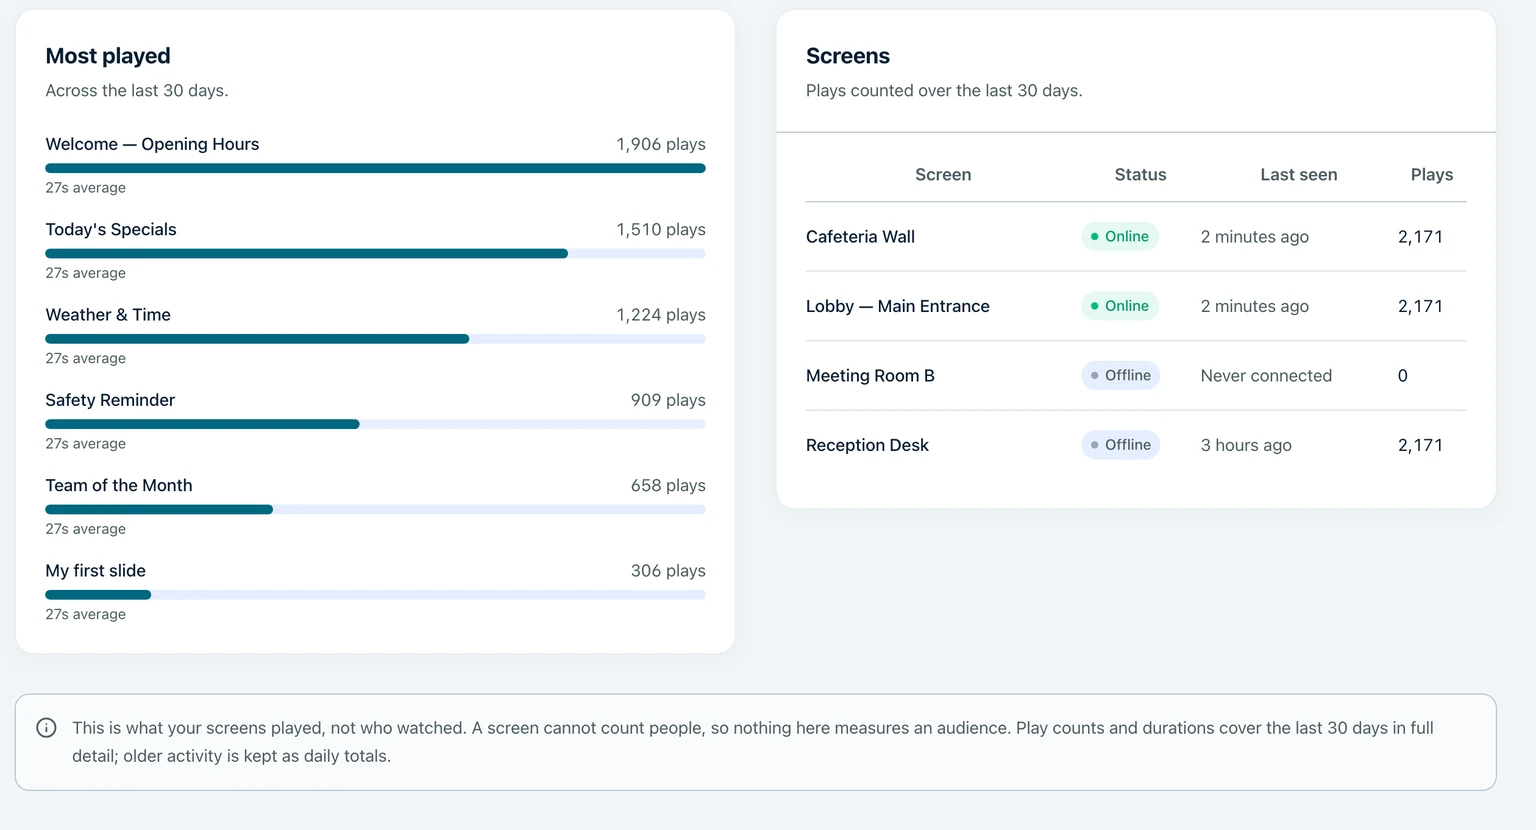
Most played ranks your slides by how often they went up, with each one’s average time on screen underneath. Screens lists every paired screen with its status, when it was last seen, and how many plays it contributed — including the ones that contributed none.
What this does not measure
Live status, screen by screen
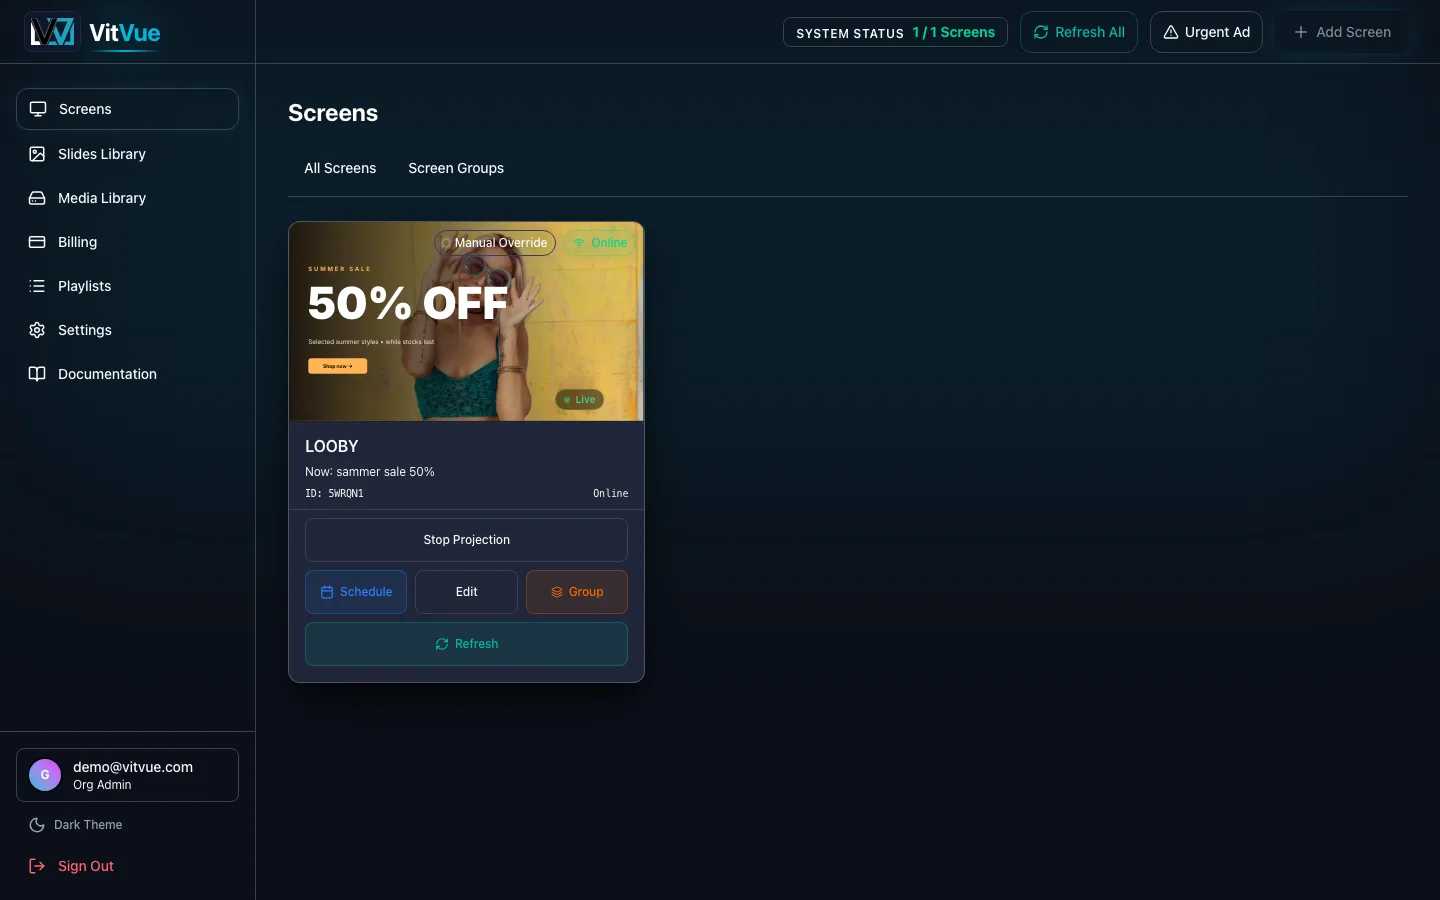
For the current moment rather than the trend, the Screens page is the status board. Each card shows what that screen is playing under Now: and whether it has checked in. A screen counts as online when it has reported within the last two minutes; players report every 30 seconds.
Slides that get cut short
Playback history also drives a banner on the Slides Library: it names slides being cut short relative to your own average, so you can shorten them, reschedule them, or retire them.
How long history is kept
- Play-by-play records are kept for 30 days.
- Older activity is rolled up into daily per-screen, per-slide totals and kept long-term, so trends survive without storing every event forever.
- Insights reads both, so a 90-day range is complete — it does not stop at the 30-day boundary.